[grid@rac1 osw_monitor]$ cd oswbb [grid@rac1 oswbb]$ cat Exampleprivate.net ###################################################################### # This file contains examples of how to monitor private networks. To # monitor your private networks create an executable file in this same # directory named private.net. Use the example for your host os below. # Make sure not to remove the last line in this file. Your file # private.net MUST contain the rm lock.file line. ###################################################################### #Solaris Example ###################################################################### echo "zzz ***"`date` traceroute -r -F <node1-priv> traceroute -I -r -F <node1-priv> traceroute -r -F <node2-priv> traceroute -I -r -F <node2-priv> ###################################################################### #HP Example ###################################################################### echo "zzz ***"`date` traceroute -r -F <node1-priv> traceroute -r -F <node2-priv>
###################################################################### #Linux Example ###################################################################### echo "zzz ***"`date` traceroute -r -F <node1-priv> traceroute -r -F <node2-priv> ###################################################################### #Tru64 Example ###################################################################### echo "zzz ***"`date` traceroute -r -f <node1-priv> traceroute -r -f <node2-priv> ###################################################################### #AIX Example ###################################################################### echo "zzz ***"`date` traceroute -r <node1-priv> traceroute -r <node2-priv> ###################################################################### # DO NOT DELETE THE FOLLOWING LINE!!!!!!!!!!!!!!!!!!!!! ###################################################################### rm locks/lock.file [grid@rac1 oswbb]$
例如我这里监控的系统是linux,那么需要创建private.net文件内容如下
1 2 3 4 5 6 7 8 9 10
######################################################################
#Linux Example
######################################################################
echo "zzz ***"`date`
traceroute -r -F rac1-priv
traceroute -r -F rac2-priv
######################################################################
# DO NOT DELETE THE FOLLOWING LINE!!!!!!!!!!!!!!!!!!!!!
######################################################################
rm locks/lock.file
Testing for discovery of OS Utilities... VMSTAT found on your system. IOSTAT found on your system. MPSTAT found on your system. IP found on your system. TOP found on your system. PIDSTAT found on your system. NFSIOSTAT found on your system. ARP found on your system. TRACEROUTE found on your system. Number of RAC Nodes: 2
The following Nodes are members of RAC Cluster: Local Node: rac1 Remote Node(s): rac2
CRS is up and running on local Node
ssh test is successful on all RAC Nodes. Private.net configured on local node !
Discovery of CPU CORE COUNT CPU CORE COUNT will be used by oswbba to automatically look for cpu problems
CPU CORE COUNT = 4 VCPUS/THREADS = 4
Discovery completed.
Starting OSWatcher v8.4.0 on Thu Dec 5 21:50:11 CST 2024 With SnapshotInterval = 5 With ArchiveInterval = 360
OSWatcher - Written by Carl Davis, Center of Expertise, Oracle Corporation For questions on install/usage please go to MOS (Note:301137.1)
Data is stored in directory: /osw_monitor/oswbb/archive
Starting Data Collection...
oswbb heartbeat:Thu Dec 5 21:50:16 CST 2024 oswbb heartbeat:Thu Dec 5 21:50:21 CST 2024 oswbb heartbeat:Thu Dec 5 21:50:26 CST 2024 oswbb heartbeat:Thu Dec 5 21:50:31 CST 2024
Starting OSW Analyzer V9.0.13 Copyright (c) 2023 by Oracle Corporation
Parsing Data. Please Wait...
Scanning file headers for version and platform info...
Parsing file rac1_prvtnet_24.12.05.2100.dat ...
Parsing file rac1_pidstat_24.12.05.2100.dat ...
Parsing file rac1_iostat_24.12.05.2100.dat ...
Parsing file rac1_nfsiostat_24.12.05.2100.dat ...
Parsing file rac1_vmstat_24.12.05.2100.dat ...
Parsing file rac1_meminfo_24.12.05.2100.dat ...
Parsing file rac1_netstat_24.12.05.2100.dat ...
Parsing file rac1_top_24.12.05.2100.dat ...
Parsing file rac1_ps_24.12.05.2100.dat ...
Parsing Completed.
Enter 1 to Display CPU Process Queue Graphs Enter 2 to Display CPU Utilization Graphs Enter 3 to Display CPU Other Graphs Enter 4 to Display Memory Graphs Enter 5 to Display Disk IO Graphs Enter 61 to Display Individual OS Process I/O RPS Graphs Enter 62 to Display Individual OS Process I/O WPS Graphs Enter 63 to Display Individual OS Process Percent User CPU Graphs Enter 64 to Display Individual OS Process Percent System CPU Graphs Enter 65 to Display Individual OS Process Percent Total CPU (User + System) Grap hs Enter 66 to Display Individual OS Process Percent Memory Graphs
Enter GP to Generate Individual Process Profile Enter GC to Generate All CPU Gif Files Enter GM to Generate All Memory Gif Files Enter GD to Generate All Disk Gif Files Enter GN to Generate All Network Gif Files
Enter L to Specify Alternate Location of Gif Directory Enter Z to Zoom Graph Time Scale (Does not change analysis dataset) Enter B to Returns to Baseline Graph Time Scale (Does not change analysis datase t) Enter R to Remove Currently Displayed Graphs
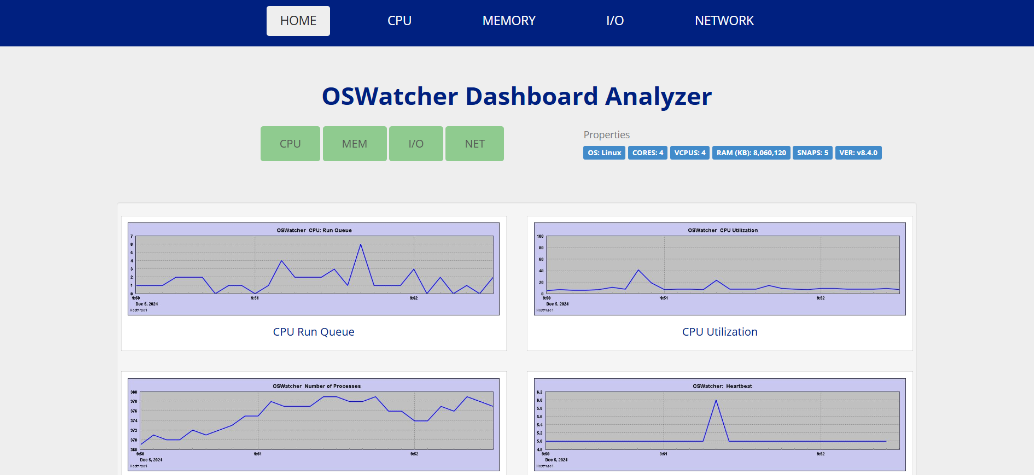
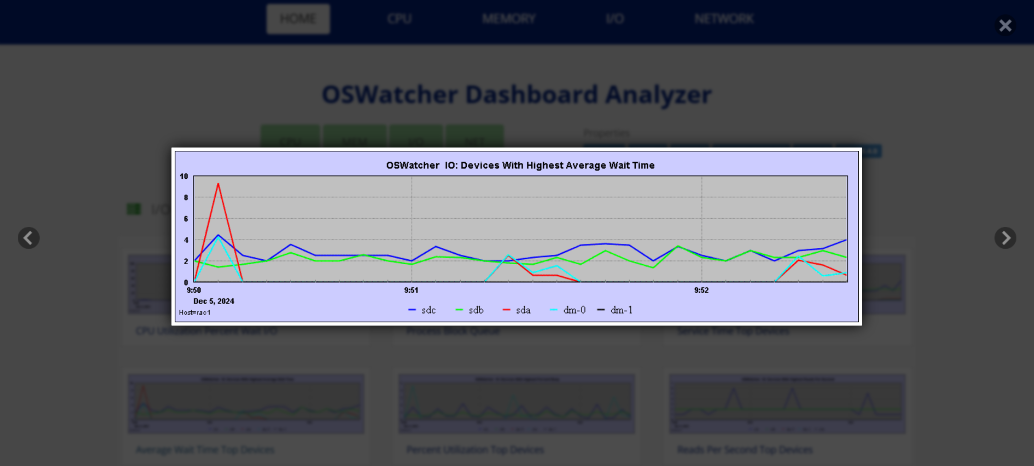
Enter X to Export Parsed Data to Flat File Enter S to Analyze Subset of Data(Changes analysis dataset including graph time scale) Enter A to Analyze Data Enter D to Generate DashBoard
Enter Q to Quit Program
Please Select an Option:D Enter a unique analysis/dashboard directory name or enter <CR> to accept default name:
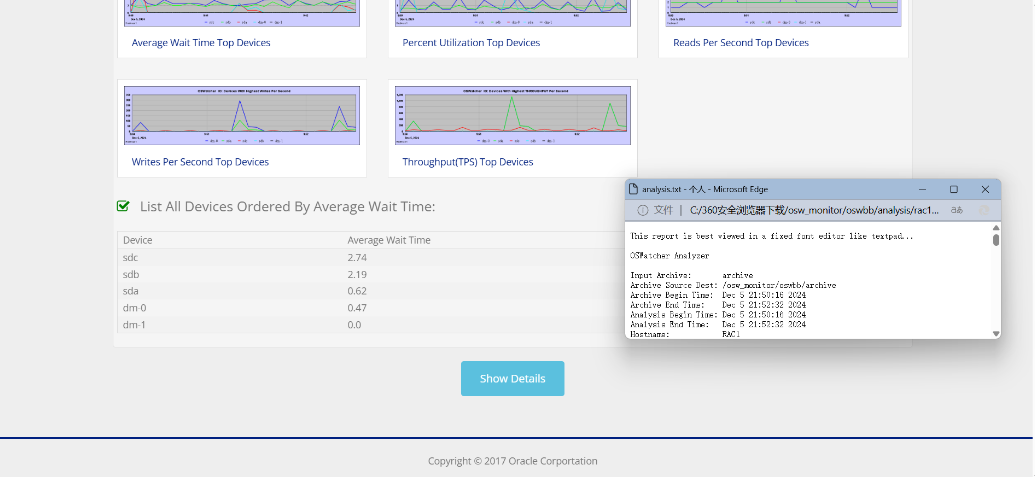
A new analysis file analysis\rac1_Dec05215016_1733407401\analysis.txt has been c reated.
Enter 1 to Display CPU Process Queue Graphs Enter 2 to Display CPU Utilization Graphs Enter 3 to Display CPU Other Graphs Enter 4 to Display Memory Graphs Enter 5 to Display Disk IO Graphs Enter 61 to Display Individual OS Process I/O RPS Graphs Enter 62 to Display Individual OS Process I/O WPS Graphs Enter 63 to Display Individual OS Process Percent User CPU Graphs Enter 64 to Display Individual OS Process Percent System CPU Graphs Enter 65 to Display Individual OS Process Percent Total CPU (User + System) Grap hs Enter 66 to Display Individual OS Process Percent Memory Graphs
Enter GP to Generate Individual Process Profile Enter GC to Generate All CPU Gif Files Enter GM to Generate All Memory Gif Files Enter GD to Generate All Disk Gif Files Enter GN to Generate All Network Gif Files
Enter L to Specify Alternate Location of Gif Directory Enter Z to Zoom Graph Time Scale (Does not change analysis dataset) Enter B to Returns to Baseline Graph Time Scale (Does not change analysis datase t) Enter R to Remove Currently Displayed Graphs
Enter X to Export Parsed Data to Flat File Enter S to Analyze Subset of Data(Changes analysis dataset including graph time scale) Enter A to Analyze Data Enter D to Generate DashBoard


